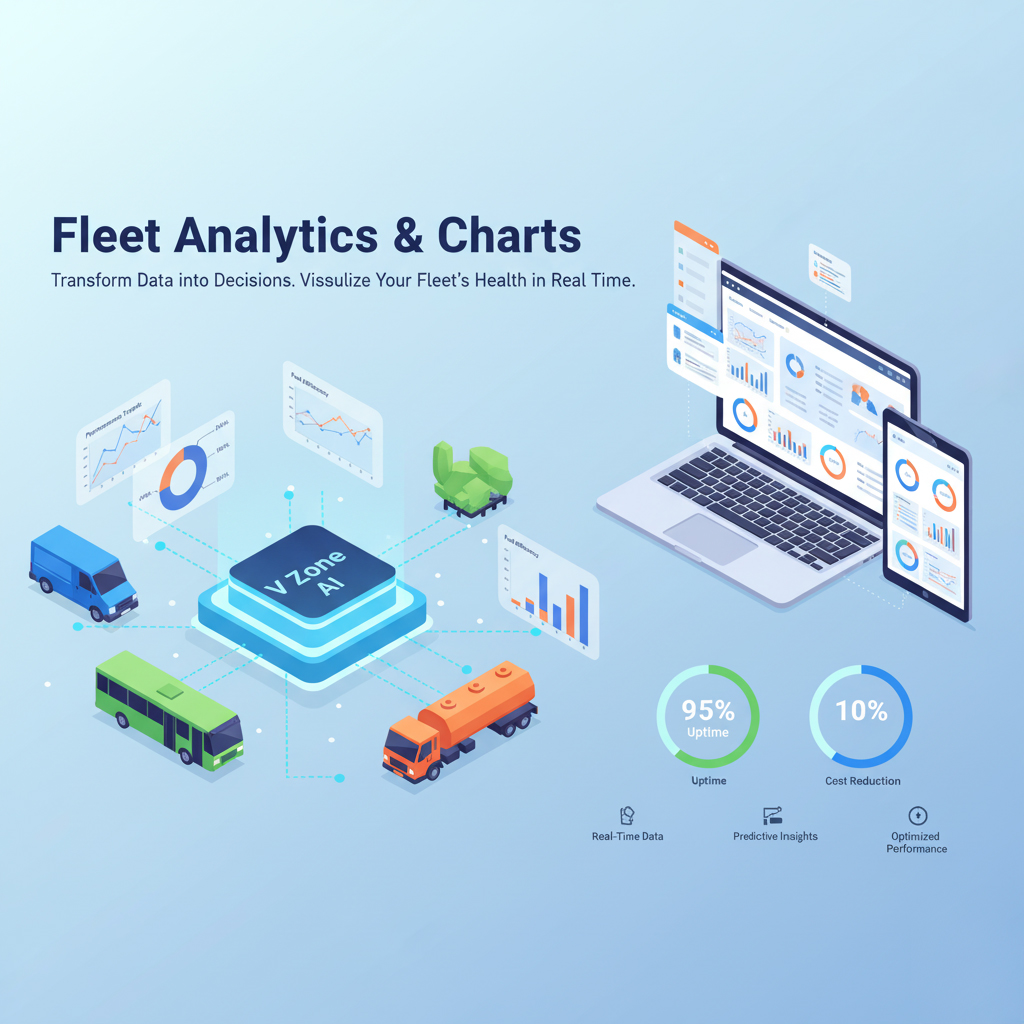
Fleet Analytics & Charts
Transform Data into Decisions. Visualize Your Fleet’s Health in Real Time.
🔍 Overview
Modern fleet management generates thousands of data points daily. But data without context is just noise. V Zone’s Fleet Analytics & Charts transforms complex operational data into clear, actionable visuals that reveal what’s working, what’s wasting, and where to optimize.
From speed and fuel to temperature and load – every KPI you care about is now a chart away.
📈 Key Dashboards & Charts
🛣️ Trip Performance Charts
- Visualize distance covered, trip count, idle time, and stop duration.
- Compare between vehicles or time periods.
- Identify high-performing routes and problematic patterns.
⛽ Fuel Consumption & Theft Analytics
- Graph fuel usage trends over days/weeks/months.
- Spot under-refueling, sudden drops, or theft indicators.
- Compare fuel efficiency by driver or route.
🚦 Speed & Harsh Behavior Trends
- Charts for overspeed, harsh braking, sharp cornering, and acceleration.
- Filter by driver, trip, or fleet type.
- Score drivers and coach them accordingly.
🕒 Excess Idle Time Trends
- Identify vehicles with the most idle hours.
- Calculate cost of unproductive engine time.
- Set benchmarks for corrective action.
🌡️ Temperature & Cold Chain Analytics
- Real-time and historical temperature charts.
- Alerts for range violations or fluctuations.
- Ensure compliance for pharma, food & sensitive goods.
🚪 Door Status & Access Reports
- Monitor open/close events with timestamps.
- Spot early/late door access or prolonged openings.
- Get alerts for unauthorized access attempts.
⚖️ Load Sensor Charts
- Track vehicle load vs. capacity across trips.
- Identify overloading or underutilization.
- Time and place-based load analytics.
📋 Service & Maintenance Trends
- Visualize vehicle-wise service history.
- Predict next due dates based on usage.
- Track downtime trends across the fleet.
💸 Expense Charts
- Visual breakdown of vehicle-wise or driver-wise costs.
- View monthly cost per km or per trip.
- Set alerts for exceeding cost thresholds.
🎛️ Smart Features
- ✅ Interactive filters for date, driver, vehicle group, region
- ✅ Export to Excel, PDF, or schedule as email reports
- ✅ Dashboard widgets for your fleet KPIs
- ✅ AI highlights for anomalies and outliers
- ✅ Mobile-friendly data visuals
🧠 Why It Matters
- ✔️ Replace spreadsheets with dynamic visuals
- ✔️ Spot trends early and take faster action
- ✔️ Align team performance with fleet benchmarks
- ✔️ Improve decision-making with accurate data
- ✔️ Strengthen accountability with visual evidence
📌 Real-World Impact
"We reduced excess idling by 40% in 2 months – just by monitoring behavior charts and acting on the insights."
— Fleet Ops Manager, Food Logistics
"Fuel theft detection became 2x faster using sudden drop graphs combined with sensor alerts."
— Compliance Head, Government Transport
👨💻 Who Uses It?
- Fleet Managers – Daily operational insights
- Finance Teams – Monthly cost and ROI reports
- Compliance Officers – Proof for audits and regulations
- Operations Heads – Strategic planning and optimization
🧪 V Zone In Action
- AI auto-generates weekly anomaly charts
- Highlights top 5 underperforming vehicles
- Predicts next service based on historical usage
🚀 Ready to See Your Fleet Clearly?
Fleet Analytics & Charts lets you stop guessing and start leading with clarity.
From high-level trends to drill-down details – see what matters.